Swing Highs & Swing Lows
The Essential Peaks and Valleys of Price Action in Trading
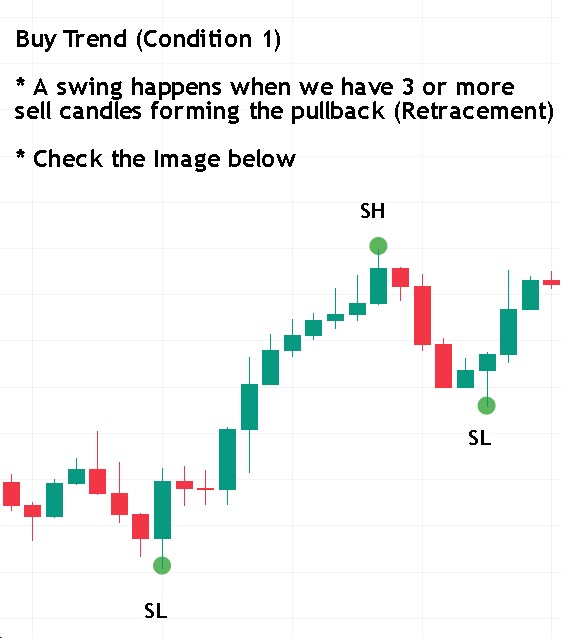
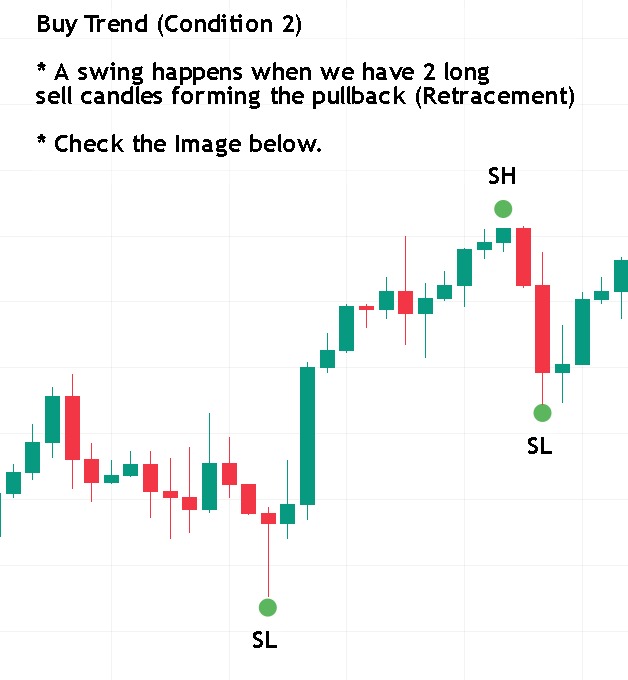
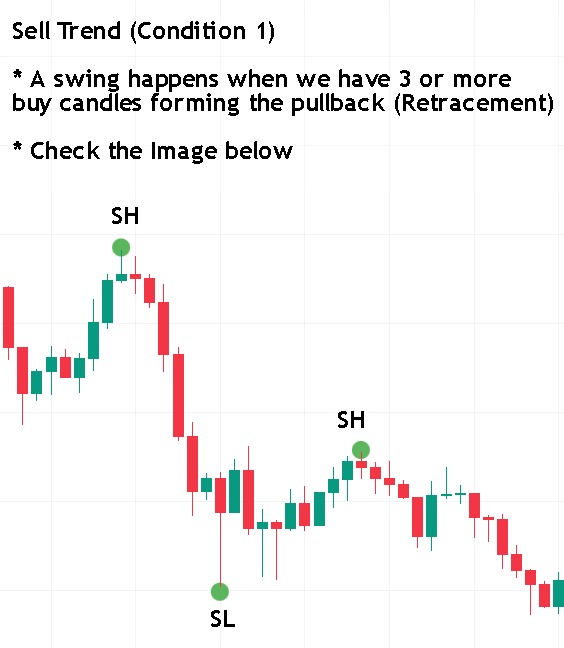
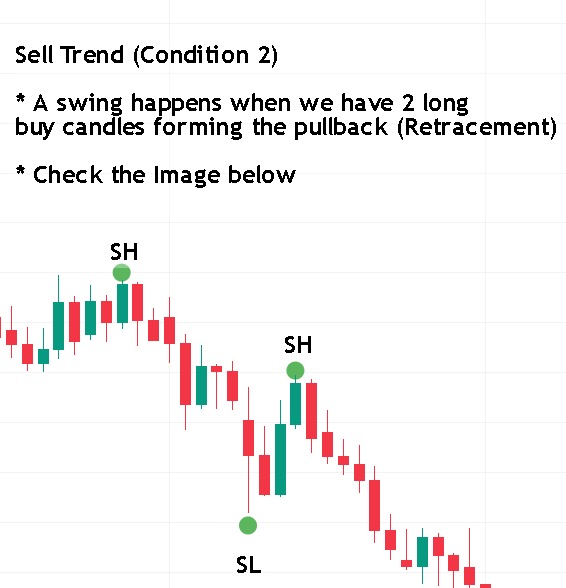
🔺 Swing High (The Peak)
A Swing High marks the highest point price reaches in a given move before reversing downwards. It acts as a potential resistance level.
Price Moves Up
📈
Forms a Peak
⛰️
Price Moves Down
📉
🔻 Swing Low (The Valley)
A Swing Low marks the lowest point price reaches in a given move before reversing upwards. It acts as a potential support level.
Price Moves Down
📉
Forms a Valley
🏞️
Price Moves Up
📈
🧠 A Simple Analogy: Hills and Valleys
Imagine a line of hills and valleys — you’re just marking the tops and bottoms.
⛰️
The Hilltops
The very tops of the hills, where the land stops rising and begins to descend, are the market's **Swing Highs**.
🏞️
The Valley Floors
The lowest points in the valleys, where the land stops falling and begins to rise, are the market's **Swing Lows**.
Identifying these points is a crucial first step for traders to understand market structure, trends, and potential areas of support and resistance.