📈 Fibonacci Strategy Trading Plan
Using Higher Timeframe Confluence
🔍 1. Identify the Market Trend (Higher Timeframe)
- Use the 4H or Daily timeframe to determine the overall trend.
- Spot breaks of previous highs (uptrend) or lows (downtrend).
🧭 2. Mark the Break of Structure & Wait for Retest
Look to the left for the last major structure break and draw a zone around that area:
- Demand zone (break of highs in an uptrend).
- Supply zone (break of lows in a downtrend).
✅ Strategy: We use a break-and-retest method:
- Wait for the zone to be broken (market structure shift).
- Wait for price to retest the same zone.
- Enter only if you also have:
- Zone aligns with Fibonacci 50% or 61.8% level.
- UTBOT confirmation (candle close at zone).
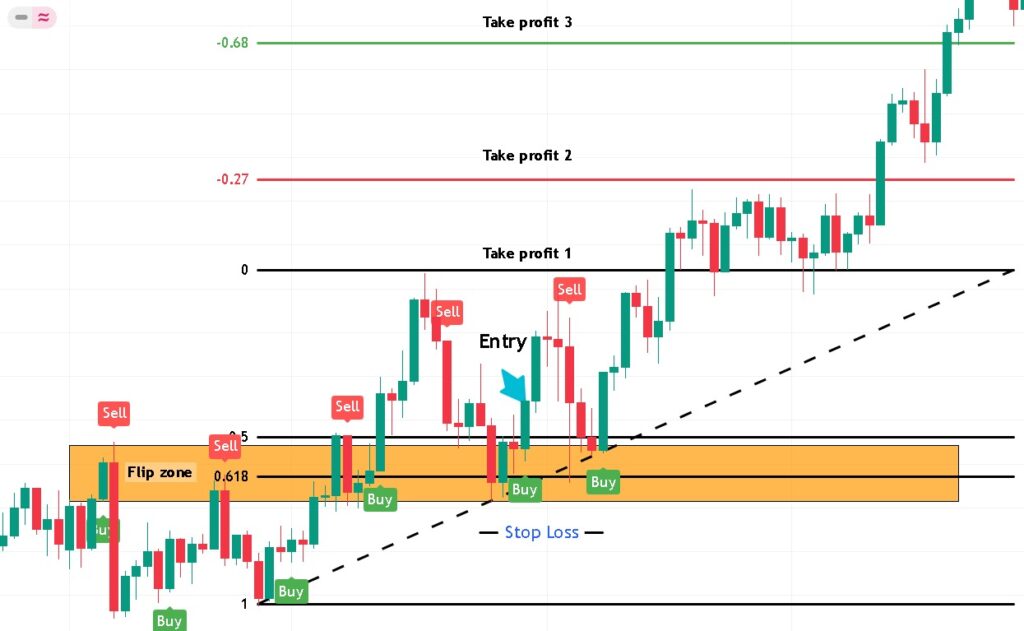
🔄 When a demand zone is broken, it can become a new supply zone, and vice versa. This is called a flip zone.
📐 3. Apply the Fibonacci Tool
- In an uptrend: draw from swing low → swing high.
- In a downtrend: draw from swing high → swing low.
- Focus on 50% and 61.8% retracement levels.
🎯 4. Look for Confluence
- Check if the retested zone aligns with the Fib 50% or 61.8% level.
- If yes, mark it as a strong entry zone.
- This gives double confluence.
🚦 5. Confirm Entry with UTBOT
- Switch to lower timeframe (e.g. H1) for entry.
- Wait for UTBOT signal + candle close at the zone.
- Only enter when all 3 confluences align.
🛡️ 6. Set Your Stop Loss
- Place SL just below demand (for buys) or above supply (for sells).
- Risk max 1–2% of your capital per trade.
💰 7. Set Your Take Profit Levels
Use Fibonacci Extensions:
| TP | Fib Level | Description |
|---|---|---|
| TP1 | 0% | Previous swing high/low |
| TP2 | -0.27% | Aggressive short-term target |
| TP3 | -0.68% | Extended long-term target |
- Take partials at TP1 & TP2.
- Let TP3 run with a trailing stop.
📊 8. Manage Your Risk
⚠️
Risk max 2% per trade.
🧮
Use a lot size calculator.
📓
Maintain a trading journal for review.